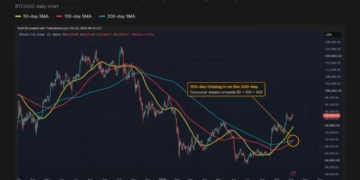
- Bitcoin 50-, 100- and 200-day simple moving averages are one crossover away from full bullish alignment, where the 50-day sits above the 100-day and the 100-day above the 200-day. It would be the first such configuration since one formed on June 24, 2025.
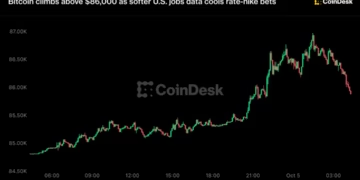
- The three averages are extraordinarily close together, at $79,495, $79,493 and $79,539 respectively, a spread of just $46 across all three. Bitcoin itself trades at $86,066.53 after rising more than 40% to $87,000 during the third quarter, with the advance stalling near $85,000 amid a sustained uptrend in the US dollar index.
- The historical record is mixed. An alignment formed in October 2020 with bitcoin near $13,600 held until May 2021, by which point it had passed $64,000, and one confirmed in early November 2023 held until May 2024 as bitcoin rose from roughly $35,000 to $73,000.
- The two most recent were far less rewarding. The June 2025 alignment lasted 97 days and delivered a move from about $106,000 to $112,000, while a June 2024 setup lasted 20 days and bitcoin fell around 10%.
What Happened?
Vikram Subburaj, chief executive of India-based Giottus exchange, said the crossover would restore the order last seen in June 2025 and confirms the recovery has endured. He cautioned that it strengthens the trend case without guaranteeing continuation, and that subsequent price behaviour determines whether it becomes a sustained bull market structure or another short-lived alignment. The more consequential test, he said, is whether bitcoin can hold the 50-day average during a correction.
Why It Matters?
The $46 spread across three moving averages is the detail that undermines the signal rather than supporting it. Averages converging that tightly means the 50-, 100- and 200-day readings are effectively identical, which describes a market with no established trend rather than one with momentum across every timeframe. Which order they finish in on any given day is close to arbitrary at that spacing, and treating the resulting sequence as information attributes precision the data does not contain. A genuine bullish alignment typically shows meaningful separation between the averages. The track record the article supplies is the second reason for restraint, and it deserves credit for including it. Of four prior alignments cited, two preceded substantial rallies and two did not, with the most recent delivering 5.7% over 97 days and the one before that losing 10% in 20 days. A signal that works half the time is not a basis for positioning, and notably the two successful instances are the older ones while both recent attempts disappointed. Set this against what the derivatives market is saying and the picture gets harder rather than clearer. K33 described an orderly reset in bitcoin derivatives that historically precedes low forward volatility and range-bound trading, with open interest at its lowest since March. That argues for consolidation, which is precisely what converged moving averages describe. Two credible readings point to a market without direction, while the technical framing presents the same conditions as bullish. Subburaj own test is the honest one: holding the 50-day through a correction would mean something, and nothing before that does.
What Next?
The crossover itself may occur within days given the $46 spread, but the more informative event is the first meaningful correction and whether the 50-day average holds. Watch the dollar index, since its uptrend is already identified as stalling bitcoin advance and dollar strength has weighed on the asset throughout this period. Open interest rebuilding from its March low would indicate leverage returning, which historically precedes sharper moves in both directions. For anyone weighing this signal, the practical framing is that it describes where price has been rather than where it is going, and the two most recent instances produced a modest gain and a loss.
Affected Tickers and Coins: BTC, COIN, MSTR
Source: CoinDesk