- US debt held by the public reached 100% of gross domestic product for the fiscal year that ended Sept. 30, hitting the triple-digit mark for the first time since 1946. The $32.2 trillion figure came to 100.03% of output once Thursday’s third-quarter GDP data were in.
- The ratio rose 0.63 percentage point from 99.4% at the end of fiscal 2025, but came in about 0.57 point below the Congressional Budget Office’s February forecast of 100.6%. It now sits roughly 6 points below the 1946 record of 106%, set after the borrowing needed to win World War II.
- The annual deficit was nearly $2 trillion, or 6.2% of GDP, extending an unusual streak of heavy red ink outside of wars, recessions and emergencies. The economy grew at a rapid clip in the third quarter, but federal borrowing is increasing just as quickly.
- The debt ratio has roughly tripled since 2000, when it stood at 33.7% and was falling amid budget surpluses. Repeated tax cuts, emergency spending after 9/11, the 2008-09 financial crisis and the Covid-19 pandemic, plus rising Social Security and Medicare costs, drove the turnaround.
What Happened?
The government had already reported that publicly held debt stood at $32.2 trillion on Sept. 30, and Thursday’s first estimate of third-quarter GDP completed the fiscal-year output figure. Economists prefer this measure to the gross federal debt, which recently passed $40 trillion, because the gross figure includes money one arm of government owes another, such as Treasury securities held in the Social Security trust fund. The US crossed 100% in an intrayear calculation earlier this year, and revisions to GDP or changes in debt issuance could still move the final ratio.
Why It Matters?
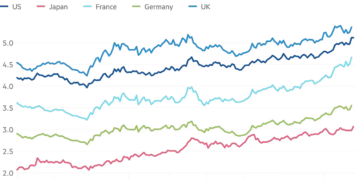
For bond investors, the milestone underscores the supply pressure behind elevated long-term Treasury yields. Net interest costs, the least flexible part of the budget, are projected by CBO to climb by more than 1% of GDP over the next decade, and that forecast assumed rates well below today’s levels. CBO estimates that if all interest rates run just 0.1 percentage point above its forecasts, interest costs rise by $379 billion over 10 years, creating a feedback loop between higher yields and wider deficits.
What’s Next?
Watch revisions to third-quarter GDP, which could nudge the ratio, and CBO’s next baseline, which will have to reflect today’s higher rates. Social Security is projected to reach insolvency in 2032, triggering automatic benefit cuts unless Congress acts. CBO Director Phillip Swagel said lawmakers understand the “challenging fiscal trajectory,” but that a politically divided country makes a fix difficult.
Affected Tickers and Coins: TLT, IEF, GOVT, SHY
Source: The Wall Street Journal