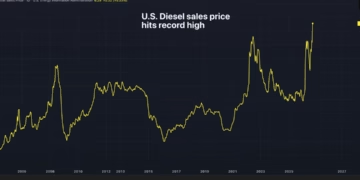
- Brent crude rose around 4% to above $104 after a fresh tanker attack in the Persian Gulf, heading for its highest close since mid-September, while US crude gained 5.20% to 92.87. Production cuts in the Gulf of Mexico caused by a hurricane added to the pressure.
- The cause is an escalation rather than a new disruption. The United States had recently succeeded in restoring crude shipments through the Strait of Hormuz, and Iran appears to have intensified its attacks on tankers in response, leaving oil markets on edge.
- Equities retreated. Futures pointed to a second consecutive decline for US benchmarks after they reached records, with the E-mini S and P 500 contract down 0.28% at 7,830.75, as the reprieve from Wednesday’s solid 10-year Treasury auction faded. The 10-year yield sat at 5.31% and gold at 4,144.60.
- The timing of the record run had fit a seasonal pattern. The fourth quarter of a midterm election year has averaged a 6.6% return for the S and P 500 since 1950, roughly 29% annualised.
What Happened?
Spencer Jakab argues the midterm effect reflects resolution of uncertainty rather than gridlock. A study in the Journal of Financial Economics covering 145 years found US equity premiums averaged an annualised 15.4% in the five months following a midterm election against 3% in all other months, with most gains arriving after the vote, while Treasuries have tended to perform worse than usual afterward. He notes that 2002, the last time a president’s party gained control of Congress at the midterms, still produced a 7.9% quarterly gain despite eliminating gridlock. Betting site Polymarket implied a 93% chance of Democrats winning a House majority and 65% for the Senate.
Why It Matters?
The escalation dynamic is the development that should change expectations. The Energy Information Administration projected Middle East production and exports would gradually rise as transits through Hormuz increased and producers found workarounds, and that is what happened. The response was intensified attacks on tankers. Restoring flow through the strait is provoking disruption rather than resolving it, which means the supply risk is not a fixed obstacle that diplomacy steadily clears but a reactive one that responds to progress. Anyone modelling a return to normal shipping should treat partial restoration as a trigger rather than a milestone. That has immediate consequences elsewhere in the queue. The G7 agreed to release up to 100 million barrels over four months and the EIA forecast retail diesel falling from above $6 a gallon to $4.50 next year, both premised on supply conditions easing. With US distillate inventories at 105.2 million barrels and 14% below the five-year average, and services prices paid at a four-year high, renewed oil strength feeds directly into the inflation path ahead of consumer price data on October 14. On the seasonal argument, the 2002 counterexample is what makes it work, since a year that eliminated gridlock still delivered strong returns, pointing to resolution rather than paralysis as the mechanism. The caution is that a 145-year calendar effect published five years ago and now widely known should be partly arbitraged, and Jakab himself observes the gains are arriving before the vote this cycle. The Treasury side is the more actionable historical pattern: government bonds have tended to underperform after midterms as the pre-election safety trade unwinds, which compounds a setup where the 10-year already sits at 5.31% and the long end is driven by term premium rather than policy expectations.
What Next?
Whether Iran sustains attacks on tankers now that Hormuz shipments have partly resumed is the variable that matters most for energy and, through it, for the rate path. The hurricane-related Gulf of Mexico shut-ins should reverse within days, which will separate temporary from structural supply loss. Consumer price data on October 14 arrives with oil higher than when the forecasts underpinning it were made. The midterms on November 3 are the resolution date the seasonal case depends on, and prediction market pricing is a live gauge of how much certainty is already in prices. For bond holders, the historical pattern of weaker post-election Treasury returns is the base case to weigh against current yields.
Affected Tickers and Coins: BZ, CL, GC, ZN, ES
Source: The Wall Street Journal