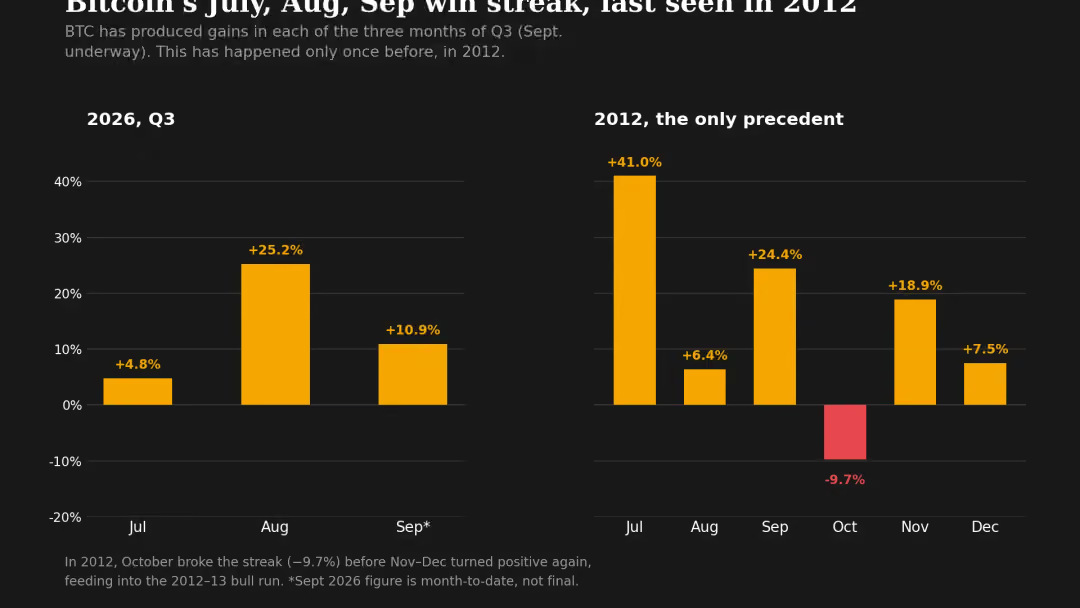
- Bitcoin’s rare three-month winning streak: July +4.8%, August +25.2%, September +10.9% (through Sept. 22). On track for first July-to-September winning streak since 2012. Only prior instance (July 41.0%, Aug 6.4%, Sept 24.4%) followed by red October (-9.7%) then major 165-day bull run (+2,000% to $230 by April 2013). Article analyzes whether 2026 follows similar path (Oct drawback → bull run) or diverges. Sample size too small (one precedent since Bitcoin traded late-2010) to draw meaningful conclusions. Four-year cycle models suggest potentially bullish phase beginning Oct-Nov, though cycles are approximate rather than fixed.
- Market structure transformed since 2012: Bitcoin in 2012 was thinly traded asset worth ~$10; small buyer pool could move prices. Today: multi-trillion-dollar asset with institutional participation, deep spot/derivatives liquidity across dozens of venues, broad range of directional strategies (options, futures, basis trades). Vikram Subburaj (Giottus CEO): “Rally of 2,000%+ that followed 2012 cannot become reasonable expectation for 2026. Present market structure different, driven by institutional capital.” Key insight: “Real change is one of market structure. Bitcoin’s rise in 2012 began in market transformable by small buyer pool. 2026 depends on whether large pools continue allocating after easiest gains made.”
- Institutional inflows suggest durability: Spot ETFs pulled in $5.5B since August (via SoSoValue). Bitget Wallet’s Lacie Zhang argues significance lies less in historical pattern, more in what’s driving it (institutional flows). Zhang: “Whether spot inflows remain positive after squeeze fades will be more useful signal of durability than calendar pattern.” Macro headwind: Fed at 3.75-4.00%, signaling potential hike by year-end. Zhang: “Main counterweight remains macro conditions…whether spot inflows remain positive after squeeze fades will be more useful signal.”
- Cycle analyst perspective: Nansen’s Nicolai Sondergaard: “History doesn’t repeat but often rhymes. Bitcoin adhered to 4-year cycle—sometimes late, sometimes early.” Expects “some drawback in coming weeks” (red October precedent) “but not wild new low.” Notes short squeeze momentum could fade. Subburaj emphasizes durability of institutional allocations: “Durability of those allocations matters more” than historical pattern itself.
What Happened?
Bitcoin posted rare three-month July-September winning streak: July +4.8%, August +25.2%, September +10.9% (through Sept. 22). Only prior occurrence was 2012 (July 41.0%, Aug 6.4%, Sept 24.4%), followed by October -9.7% then 165-day bull run to $230 (April 2013), up 2,000%+ from October lows. Sample size too small (one precedent since late-2010 trading) to draw meaningful conclusions about 2026 outcome. Four-year cycle models suggest potential bullish phase Oct-Nov, though cycles are approximate. Market structure fundamentally different from 2012: Bitcoin now multi-trillion-asset with institutional participation, deep liquidity, derivatives (options/futures/basis trades). 2012 Bitcoin was thinly traded ~$10 asset movable by small buyer pools. Spot ETFs have pulled in $5.5B since August, suggesting institutional durability. Macro headwind: Fed at 3.75-4.00%, signaling potential year-end hike.
Why It Matters?
For BTC holders, rare pattern suggests potential October drawback (per 2012 precedent) but durability of institutional ETF inflows could limit downside. For institutional investors (via ETFs: IBIT, FBTC, ARKB), article validates Bitcoin’s evolved market structure supporting long-term allocations. For crypto market broadly, institutional participation depth suggests if rally occurs, magnitude will be lower than 2012 precedent due to larger market cap/liquidity. For macro traders, Fed rate path (potential hike by year-end) remains key variable offsetting bullish cycle narratives.
What’s Next?
Monitor October price action for potential drawback (2012 precedent suggests red month, though not guaranteed). Track spot ETF inflows through October; if positive despite potential drawback, it validates institutional durability over technical patterns. Watch Fed communications; if dovish pivot occurs, it removes macro headwind to rally. Monitor Bitcoin price action around $85K-$90K levels; if breaks above, it could trigger short squeeze rally (per article’s short squeeze momentum narrative). Also track four-year cycle metrics (if publicly available); if momentum indicators confirm bullish phase, it supports potential Q4 rally. Finally, monitor macro risk asset performance (equities, commodities); if broader market rallies on Fed dovish signals, it could create tailwinds for Bitcoin institutional adoption narrative.
Affected Tickers & Coins: BTC, IBIT, FBTC, ARKB
Source: CoinDesk