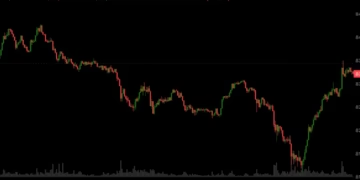
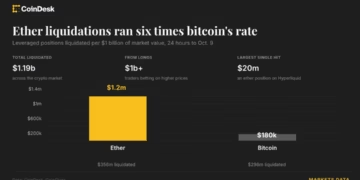
- About $803 million in leveraged positions were liquidated across crypto exchanges in 24 hours as bitcoin briefly dropped below $81,000, and the most striking element of the liquidation map was not the size of the damage—it was what caused it. A tokenized version of SanDisk (SNDK) perpetual futures contract lost more to forced liquidations ($19.5M) than XRP ($18.78M), a top-10 cryptocurrency by market cap. That single fact encapsulates a major structural shift in crypto markets: traders are now layering leverage onto traditional equity derivatives (perpetual futures tracking stocks) to the same degree they layer leverage onto crypto. And when volatility hits, those leveraged equity derivatives blow up just like crypto derivatives. The catalyst was South Korea’s KOSPI index plunging 6% intraday, with Samsung Electronics and SK Hynix each falling 8% on fears of AI valuation rotation and Chinese memory-chip competition. Bitcoin dipped below $81,000 in early Asian trading. Most of the liquidation damage—$595 million of the $803 million total—happened in a single burst over the last 12 hours of the 24-hour window. Binance alone accounted for 50% of all liquidations. Bullish bets (longs) represented 86% of the liquidations, meaning traders had positioned heavily for continued upside. When the market turned, they got wiped out in orderly cascade.
- The structure of the liquidations reveals the leverage architecture of modern crypto exchanges. Bitcoin long positions led with $181 million liquidated; Ethereum was close behind at $178 million despite having a much smaller market cap. But then traditional stock perpetual futures began showing up on the liquidation map. SanDisk perpetual futures: $19.5M. SK Hynix perpetual futures: significant (though exact number not specified). Micron perpetual futures: significant. And SOXL (a 3x leveraged semiconductor ETF that trades on crypto venues as a perpetual): $7.21M. These are equity derivatives, not crypto. Yet they sit alongside bitcoin and Ethereum on crypto exchange liquidation dashboards. The fact that SanDisk perpet futures outran XRP in liquidation size ($19.5M vs $18.78M) is the real headline. It means traders have taken on as much leverage betting on a memory-chip stock as they have betting on a major altcoin. That’s a sign of either (A) extreme risk appetite for equity leverage, or (B) crypto traders trying to catch the falling knife of chip stocks and rotate out of crypto into equity derivatives. Either way, it suggests that crypto leverage doesn’t just sit on crypto anymore. It’s spilling into traditional equities.
- Oil contracts bucked the trend. WTI and Brent crude perpetual futures actually liquidated mostly short bets, not longs, because oil climbed during the crypto/equity selloff. WTI held near $92.67 and Brent near $106 after three days of rallying on Middle East supply concerns (Saudi attacks, Houthi threats). Traders betting that oil would fall got liquidated; traders betting oil would rise made money. The divergence between crypto/equities down and oil up created a perfect storm for leveraged cross-asset traders. A trader long crypto and short oil would get destroyed on both sides. That’s the hidden risk in crypto leverage: positions are rarely isolated. They’re usually part of broader macro hedges or spread trades. A 20% allocation to crypto longs, a 30% allocation to equity index longs, and a short on oil could look balanced. But in a sell-off, if all three are leveraged and all three blow up, the losses compound. That’s starting to happen.
- The recovery pattern in the last four hours offers a clue about where the leverage risk is concentrated. Of the $74 million liquidated in the past four hours, $59 million (79%) came from short bets. That means as bitcoin bounced back above $83,000, traders who had shorted bitcoin in the dip were forced to cover. The bounce also likely benefited shorts in equities (as chip stocks stabilized) and stopped the bleeding in oil shorts (oil stayed elevated). This pattern—massive long liquidations in 12 hours, then short liquidations as the bounce happens—is textbook leverage cascade followed by short squeeze. It suggests that after Thursday’s CPI report, much of the long leverage in bitcoin will already be cleared out. That could actually reduce tail risk heading into the result: if CPI is hot and bitcoin drops further, there won’t be as many longs to liquidate and cascade lower. But it also means upside is capped: shorts will have to cover on a bounce, which should create a natural ceiling. Bitcoin is probably in a $78K-$86K range through year-end, with CPI as the pivot point.
What Happened?
Approximately $803 million in leveraged positions across 10 cryptocurrency exchanges were forcibly liquidated in 24 hours, with bullish bets (long positions) accounting for 86% of the wipeouts, as bitcoin briefly dropped below $81,000. The liquidations correlated with a sharp 6% decline in South Korea’s KOSPI index and 8% drops in Samsung Electronics and SK Hynix shares, driven by investor concerns over artificial intelligence valuation corrections and competition from Chinese memory-chip producers. Approximately $595 million (75%) of the day’s total liquidations occurred in a single 12-hour burst, with Binance accounting for 50% of all liquidations across exchanges. Bitcoin long positions led with $181 million liquidated, followed by Ethereum at $178 million. Notably, perpetual futures contracts tracking traditional equities appeared prominently on liquidation maps, with tokenized SanDisk (SNDK) perpetual futures triggering $19.5 million in liquidations, exceeding XRP’s $18.78 million despite XRP’s status as a top-10 cryptocurrency by market capitalization. Additional equity derivative liquidations included SK Hynix perpetual futures, Micron futures, and SOXL (a 3x leveraged semiconductor ETF), with SOXL accounting for $7.21 million. Oil contracts (WTI and Brent crude perpetual futures) experienced primarily short liquidations as crude prices rallied on Middle East geopolitical supply concerns. In the subsequent four hours, $74 million in liquidations occurred, with 79% originating from short positions, as bitcoin recovered above $83,000.
Why It Matters?
The liquidation pattern reveals a critical structural shift in cryptocurrency markets: leverage is no longer concentrated solely on digital assets but has spilled into tokenized versions of traditional equities and equity derivatives, creating cross-asset contagion risk. The fact that a tokenized SanDisk equity derivative contract experienced larger liquidations than XRP, a major cryptocurrency, signals that traders are deploying significant leverage on equity perpetual futures through crypto exchange infrastructure. This convergence creates systemic risk because traditional equity selloffs (like the Korean chip stock collapse) can now trigger cascading liquidations in crypto exchange infrastructure, compounding losses across both asset classes. The 86% concentration of liquidations in bullish positions, followed by a reversal creating short liquidations during the recovery, suggests that leveraged traders across multiple asset classes (crypto, equities, commodities) are using correlated positions that amplify losses during volatility. The pattern indicates that much of the long leverage in bitcoin has been cleared through forced liquidations, which paradoxically reduces downside tail risk from further selling (fewer positions to cascade liquidate) but also caps upside potential as remaining short positions cover on bounces. Thursday’s US CPI report remains the next major catalyst, but the existing leverage structure suggests binary outcomes: either a hot CPI crushes the remaining longs and creates a selling cascade, or a cool CPI triggers a short-squeeze bounce capped by supply of weak hands who just got liquidated.
What’s Next?
Monitor crypto exchange liquidation dashboards through Thursday’s CPI report. If liquidation activity remains in the $50M-$100M daily range, it suggests the leverage washout is complete and positioning is normalized. If liquidations spike above $300M again, it signals fresh leverage has been added and the market remains fragile. Track the ratio of bitcoin vs. equity derivative liquidations going forward. If equity derivative liquidations grow as a percentage of total liquidations, it confirms the structural shift toward cross-asset leverage on crypto venues. If the ratio stabilizes or reverses, it suggests traders are derisking equity derivatives. Watch for contagion signals in margin loan rates and funding rates on crypto exchanges. If funding rates (the cost of holding leveraged positions) spike significantly, it indicates fear and deleveraging pressure. If they normalize, it suggests the market is stabilizing. Monitor South Korea’s KOSPI, Samsung, and SK Hynix for stabilization signals. If those indexes bounce and stabilize above current lows, it relieves pressure on crypto markets and equity derivative perps. If they continue declining, further cascades are likely. Track Bitcoin’s behavior relative to the $81,000 support and $84,000 resistance. A break below $81,000 on heavy liquidation volume would signal fresh cascade risk. A sustained hold above $83,000 through CPI would suggest the capitulation is complete. Finally, monitor oil prices and geopolitical developments. If oil stabilizes or declines from $106, it removes an inflation headwind that could support rate-hike expectations. If oil spikes further, it reinforces bearish signals.
Affected Tickers and Coins: SNDK | SK Hynix | MU | SOXL | BTC | ETH | XRP | KOSPI | WTI | Brent
Source: CoinDesk